When a person finally decides to retire, they don’t quit their job one day, then liquidate their entire nest egg and stash it into a bank account the next day … or at least, they probably shouldn’t.
No, they withdraw money over time, which allows them to cover their expenses while the remaining nest egg continues to grow in price and/or generate income. So naturally, those withdrawals, combined with other sources of income (Social Security benefits, etc.), must be enough to pay for retirement expenses—but without depleting their nest egg so fast that they outlive their savings.
That’s where retirement withdrawal strategies come in.
Retirement withdrawal strategies use a variety of factors to determine how much you’ll regularly withdraw from your savings once you exit the workforce. Today, I’m going to review some of the most common retirement withdrawal strategies, including where they shine and where they struggle. With that knowledge in hand, you should be better armed to understand how these retirement drawdown strategies will affect your own retirement plan.
Featured Financial Products
Popular Retirement Withdrawal Strategies

Retirees have a lot of factors to consider as they map out their retirement withdrawals. How much should I withdraw each year, and how often should I do it? How flexible is my budget? How long do I need my retirement savings to last? Should I factor in inflation? What happens if my portfolio has a really good year … or a really bad year?
It should come as no surprise, then, that there are multiple strategies for withdrawing funds during retirement. Each has its own unique set of strengths and weaknesses, making that strategy either more or less ideal depending on a person’s financial situation.
Below, I’ll discuss some of the most common methods for retirement withdrawals. For each one, I’ll provide a quick explanation, lay out its pros and cons, and provide a basic example of how the strategy would play out. (Just remember: Nothing is ever set in stone. If your needs evolve, your retirement plan and withdrawal strategy might need to evolve, too.)
Withdrawal Strategy Example Assumptions
Here are the base assumptions we used for each of the examples. A few, some, many, even all of these assumptions might not apply to you. That’s OK! These assumptions were simply used to provide an illustration of how each strategy would provide different results for a prospective retiree (or, more specifically, a prospective retired couple).
The assumptions:
- Married couple filing jointly.
- 67-year-old couple who both live until age 90 (in both cases, their life expectancies are higher than the national average).
- One retiree receives full Social Security retirement benefits. Their spouse receives Social Security spousal benefits (50% of spouse’s benefit).
- Retired couple collectively earned $100,000 annually prior to retirement.
- Retired couple will need to withdraw $80,000 during their first year of retirement. (Generally suggested minimum spending requirement for the first year of retirement is 80% of pre-retirement income.)
- Money is withdrawn or reinvested on a monthly basis, on the first day of the month; however, portfolio balance and withdrawals are shown on an annual basis.
- Average annual inflation rate of 2.4%; inflation is factored in on a monthly basis.
- $1 million in combined retirement savings in tax-deferred retirement accounts.
- Portfolio allocation is 70% in stocks (total return of S&P 500, which is capital gains plus dividends) and 30% in bonds (10% in 3-month T-Bills, 10% in 10-year Treasuries, 10% in Baa-rated corporate bonds). Dividend and investment income is reinvested.
- Return data based on actual market returns between Jan. 1, 1999, and Dec. 31, 2022.
Note that there are other factors, such as what starting withdrawal percentage or dollar amount you elect, that could greatly affect the outcomes.
1. Dollar-Plus-Inflation Withdrawal Strategy
When using the dollar-plus-inflation withdrawal strategy, a retiree withdraws a set percentage of their retirement savings during the first year of retirement. Each following year, they take out the same dollar amount, plus/minus an additional sum based on inflation/deflation.
Pros
- Retirees should be able to cover yearly costs as long as the portfolio lasts
- Retirement savings should last at least 30 years
- Easy to calculate
- Accounts for inflation
Cons
- Doesn’t account for market conditions
- May run of out money if the markets are down
- Can’t enjoy greater withdrawals if the markets are up
Withdrawal strategy example
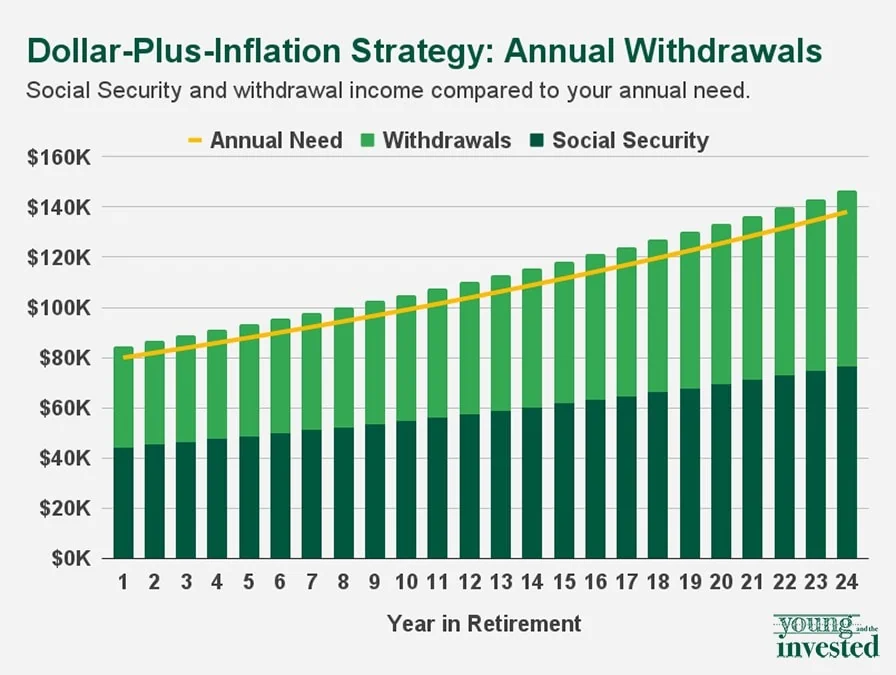
For our dollar-plus-inflation strategy, we assumed a 4% starting withdrawal rate. And great news—the couple had sufficient funds to cover their annual needs every year of the 24-year retirement.
The first year’s $80,000 income need was met with $44,263 in Social Security income and $40,443 of portfolio withdrawals for a total income of $84,706. (Why weren’t portfolio withdrawals an even $40,000? Remember: We factored for inflation on a monthly basis, so monthly withdrawals gradually increased throughout the first year, resulting in an annual withdrawal of more than $40,000.)
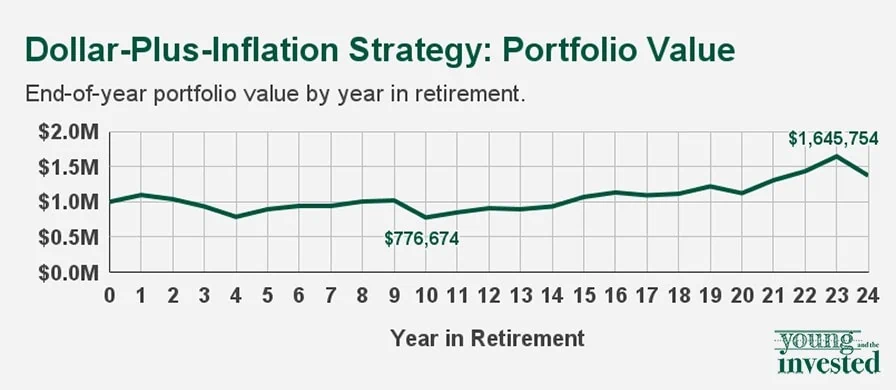
The portfolio’s low point was 10 years into the model, with a value of $776,674. But the nest egg subsequently grew over the ensuing 14 years, reaching a peak value of $1,645,754 in year 23.
What is the “4% rule”?
Even if you’ve never heard of any of the broader strategies on this list, it’s still possible you’ve heard of the “4% rule.” Well, this is the most popular variation of the dollar-plus-inflation withdrawal strategy. Under the original 4% withdrawal rule, a retiree would withdraw 4% of their portfolio during the first year of retirement. Each subsequent year, the dollar amount taken from the retirement account would increase with the rate of inflation. (Also worth noting: The portfolio must be 50% to 75% invested in stocks.)
To test the strategy, creator William Bengen looked at how the 4% rule would hold up for 50 years in retirement, based on retirement starts over a 50-year period (between 1926 and 1976). So, for instance, for a retirement started in 1935, he evaluated how the strategy would have fared between 1935 and 1985.
He found that not only would the 4% rule provide retirees with enough retirement income, but that it would also ensure the portfolio survives for at least 30 years. (Indeed, all portfolios lasted 35 years or longer, and most lasted at least 50 years!)
It’s worth noting that Bengen has since revisited the rule. He found that in many cases, retirees were passing away with a significant surplus remaining; for those who wanted to use up more of their savings, he determined that a 4.5% initial withdrawal rate would provide more retirement income yet still ensure the nest egg would last at least 30 years.
Featured Financial Products
Related: How to Invest for (And in) Retirement: Strategies + Investment Options
2. Dynamic Percentage-of-Portfolio Withdrawal Strategy
There are two common withdrawal strategies that require you to regularly withdraw a percentage of your portfolio. The first is the dynamic percentage-of-portfolio withdrawal strategy.
In the dynamic strategy, you withdraw a percentage every year. You do not account for inflation, but you do factor in market conditions. If the market does well, you can withdraw more. If it performs poorly, you withdraw less.
It’s a highly variable strategy. While people should generally consider working with a financial advisor, they should strongly consider doing so if they’d prefer to use a strategy like this one.
Pros
- Withdrawals much higher with strong market performance
- Ensures you don’t outlive savings
Cons
- Withdrawals much lower with poor market performance
- Little predictability of withdrawal amounts
- Must carefully watch market conditions, such as inflation and taxation
Withdrawal Strategy Example
For our dynamic strategy, we had two withdrawal rules based on the 70/30 portfolio’s total return (price plus dividends):
- If the 70/30 portfolio returned 6.5% or greater in a given year, the couple would withdraw 5% from the portfolio.
- If the 70/30 portfolio returned less than 6.5% in a given year, the couple would withdraw 4.5%.
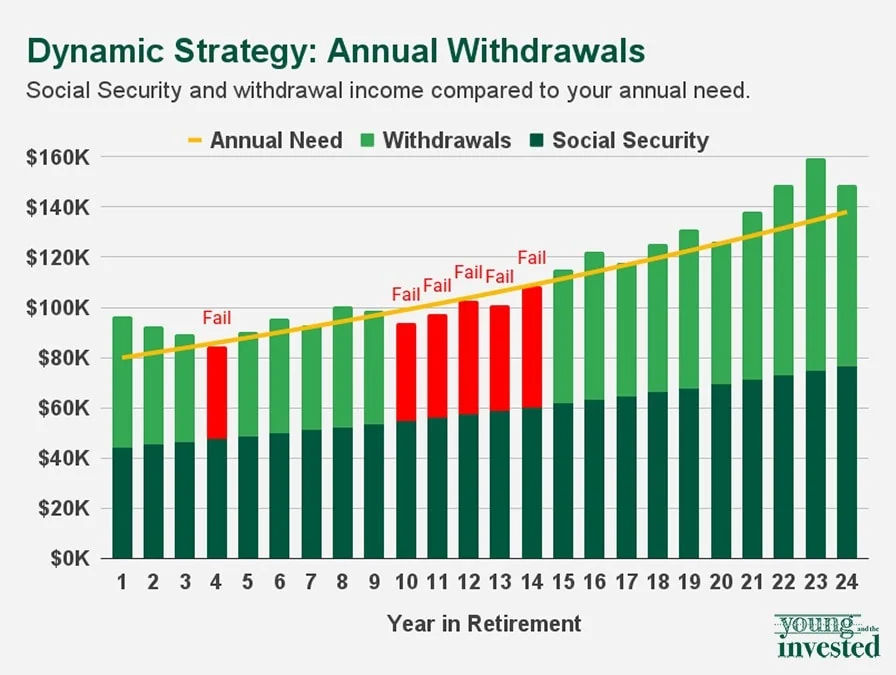
As you’ll see below, this market-responsive strategy failed to deliver sufficient income in every year of the modeled retirement period. Specifically, in six of the 24 years considered, portfolio withdrawals failed to fully supplement Social Security payments, so the couple fell short of their annual need in those years. The biggest gap in those six years saw a nearly $5,500 shortfall in year 13; the smallest shortfall was just over $600 in year 14. After the yawning gap in shortfalls between years 10 through 14, the portfolio withdrawals were sufficient to meet annual retirement income needs.
A very important consideration: These models are meant to illustrate strengths and weaknesses of these strategies. Just because a strategy fails in our example models doesn’t mean the strategy will never work. But it does mean that the strategy might be better in some situations than others.
The dynamic strategy failed here because the stock market’s year-to-year performance was weak early on. That hurt the overall portfolio value and forced the couple to take lower withdrawals than they needed. Lesson learned: The dynamic strategy could suffer if your retirement start date is quickly followed by a prolonged slump in stocks.
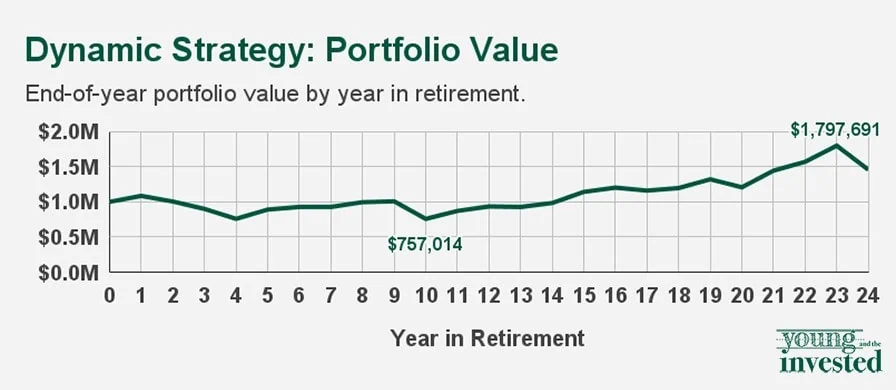
However, look at portfolio growth over time. The portfolio’s low point was 10 years into the model, with a value of $757,014 … but the nest egg grew robustly over the ensuing years, and its portfolio peak of $1,797,691 in year 23 was higher than any strategy in this article achieved.
Related: When Should You Take Social Security?
3. Fixed-Percentage-of-Portfolio Withdrawal Strategy
The other, less flexible method is the fixed-percentage-of-portfolio strategy. Here, a retiree withdraws a set percentage of retirement savings each year, regardless of both market performance and inflation.
Because withdrawals are always taken as a percentage of the portfolio, withdrawals will vary based on market performance. But unlike the above strategy, you don’t change the percentage based on market performance.
Pros
- Ensures you don’t outlive savings
- Simple to implement
- Withdrawals somewhat higher with strong market performance
Cons
- Little predictability of withdrawal amounts
- Inconsistent income makes budgeting a challenge
- Withdrawals somewhat lower with poor market performance
Withdrawal Strategy Example
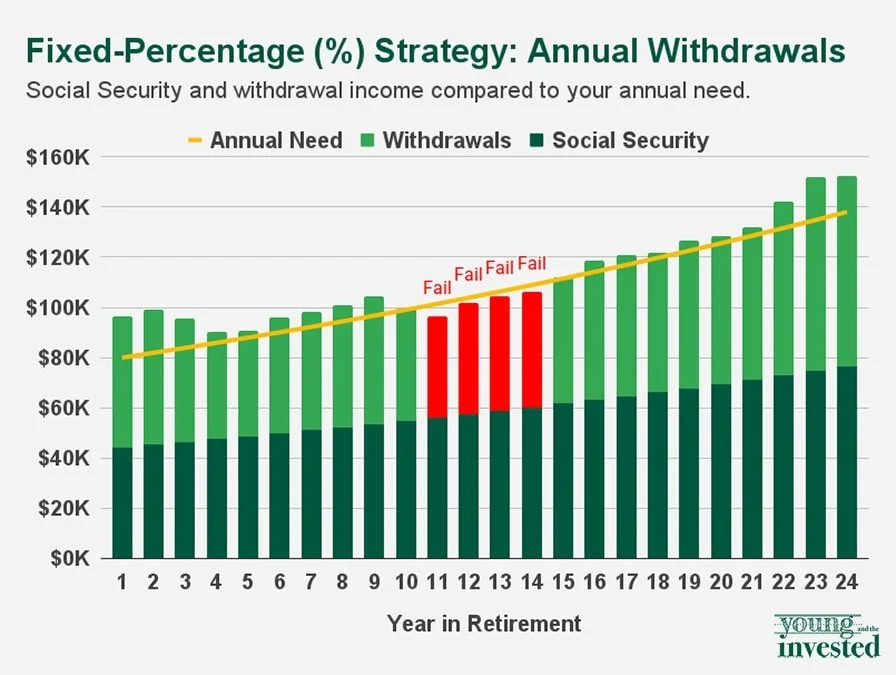
For our fixed-percentage strategy, we relied on using a constant 5% portfolio withdrawal rate through the entire retirement period.
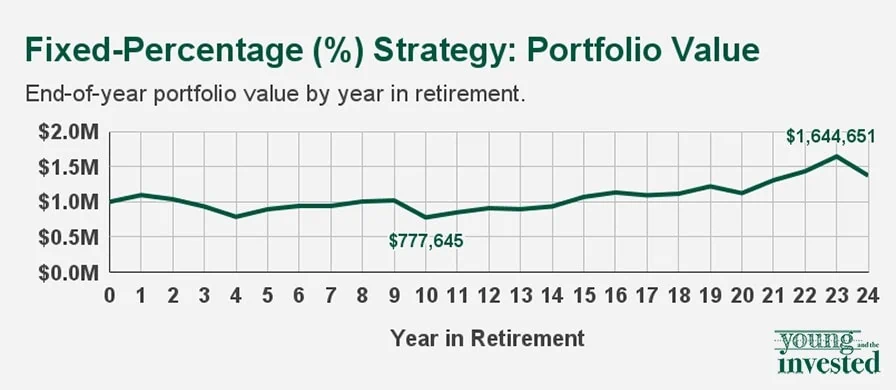
As you can see in our chart below, this retirement drawdown strategy worked for most (but not all) years. In years 11 through 14, withdrawals failed to achieve the necessary annual retirement income marks. The biggest gap came in year 11, with a $4,800-plus shortfall. The smallest gap ($2,000) came the following year. The problem, naturally, was that a big decline in the market limited the size of withdrawals. As the portfolio rebounded, so too did withdrawal income.
The portfolio’s low point was 10 years into the model, with a value of $777,645. However, the nest egg rebounded over the ensuing 14 years and reached a peak value of $1,644,651 in year 23.
Related: Health Care Costs in Retirement [Amounts + Types to Expect]
4. Fixed-Dollar Withdrawal Strategy
The fixed-dollar withdrawal strategy has you take a predetermined, dollar-determined amount of money out of your retirement account each year. It does not hinge on inflation nor market conditions.
Pros
- Simplifies budgeting and planning
- Maximum predictability of withdrawal amounts
Cons
- Fixed withdrawal amount will have less purchasing power over time
- Poor investment performance is a significant risk to portfolio longevity
- Higher probability of outliving your savings
Withdrawal Strategy Example
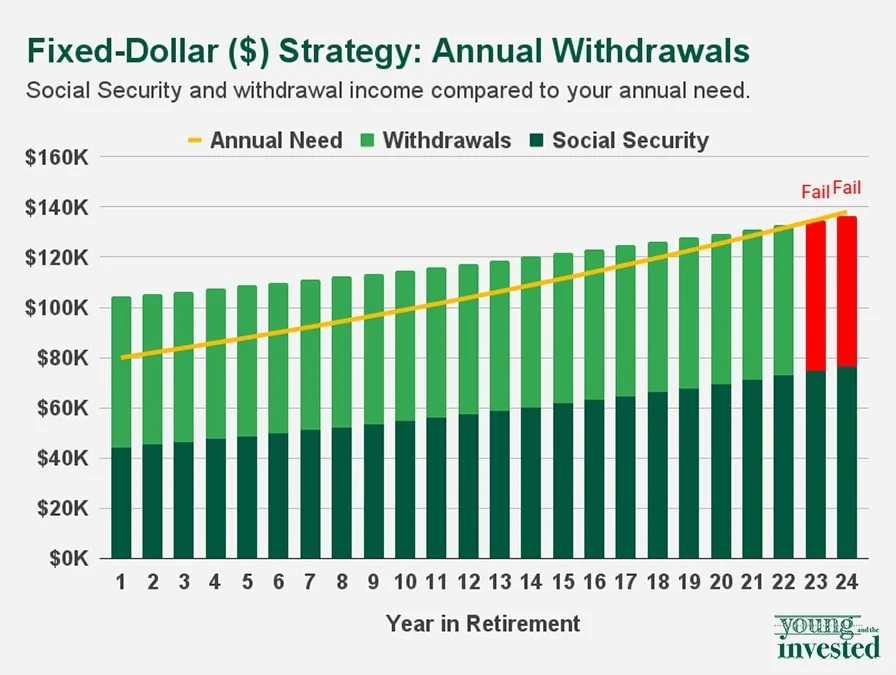
The most predictable retirement withdrawal income strategy of the bunch, the fixed-dollar withdrawal strategy modeled here provides the couple with $5,000 of monthly income ($60,000) per year, regardless of market conditions or inflation.
The strategy met the annual retirement income need in every year until the final two; however, meeting this mark each year required setting a very high initial withdrawal amount. That’s because the strategy doesn’t allow for making adjustments due to inflation later in retirement—you set the withdrawal rate and forget it, hoping your portfolio can bear this steady stream of distributions.
Look at the middle of the retirement period. In year 11, fixed withdrawals represented a 10%-plus withdrawal rate! And these withdrawals remained substantially elevated compared to other strategies for the remaining years, bouncing between 7.2% and 9.4% each year.
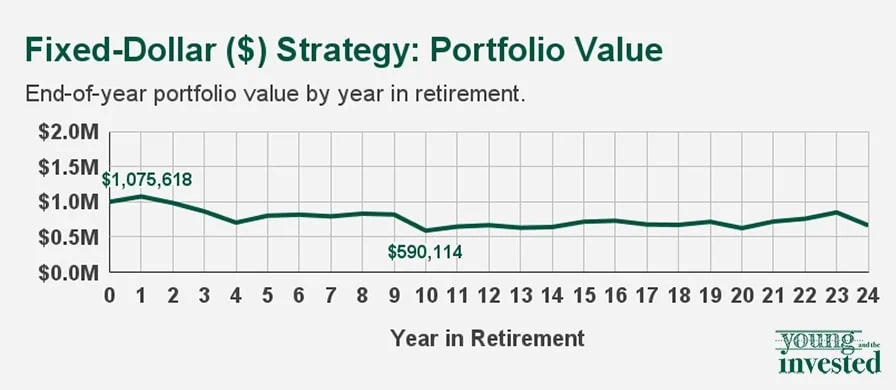
Also, you can clearly see a difference in how portfolio value changed over time compared to our other listed drawdown strategies, including the lowest final portfolio value (by a lot!) at the end of the period. You can chalk that up to two primary factors:
- Initial withdrawals represented a large withdrawal percentage relative to the portfolio size.
- These relatively high withdrawals continued even as poor initial portfolio performance ate away at the portfolio’s value.
The highest portfolio value ($1,075,618) came very early on, at the end of year 1. Like with the other strategies, fixed-dollar’s nadir came in year 10—and that $590,114 value represented the lowest trench of the four methods listed here. The portfolio remained rangebound for the remainder of the retirement period.
Related: Want to Retire Early? Don’t Make These Mistakes
The Concept of Retirement “Buckets”
Retirement buckets aren’t a withdrawal strategy so much as an organization of one’s capital and investment strategies.
The idea here: You mentally divide your retirement savings into three “buckets”:
- Short-term: Money in one’s short-term bucket is what is needed for the next one to five years. As this money needs to be used soon, you should keep it in safe, liquid investments such as cash, money market funds, and certificates of deposit (CDs).
- Intermediate-term: The intermediate bucket holds funds to cover expenses for the next five to 10 years. These investments don’t have to be quite as liquid, so you can afford to invest in assets with a bit more growth and/or income potential. For instance, your intermediate bucket could include defensive/dividend stocks and bonds with shorter maturity dates.
- Long-term: You want the investments in your long-term bucket to keep increasing in value to ensure you have enough retirement income longer than 10 years down the road. You can put more aggressive stocks and bonds with longer maturity dates into this bucket.
And note: To get your stock and bond exposure, you can buy individual securities, but you might be better off holding diversified bundles of stocks and/or bonds through mutual funds, exchange-traded funds (ETFs) and closed-end funds (CEFs).
Featured Financial Products
How Long Will Your Savings Last in Retirement?
While a few variables (market performance, inflation) are out of your hands, you can still exert some control over your portfolio’s longevity through your withdrawal strategy. Withdrawing a lower fixed amount each year will make it last longer; a higher fixed amount each year will make it last for a shorter period of time. Not withdrawing more during up markets will help extend your savings’ life. So will withdrawing less during down markets.
Of course, many of these measures could reduce your quality of life in retirement. And you might be doing so needlessly—retirees can be too conservative, passing away with a massive savings surplus they could have used enjoying their post-career years.
It’s perhaps best to compare a withdrawal strategy to cooking instead of baking. Baking requires you to follow a recipe to the exact detail, where cooking follows a general gameplan but provides more room for flexibility. The 4% rule might make sense until it doesn’t—at that point, you might be better served switching to a different strategy.
A financial professional can help you not only draw up a plan to make your portfolio last, but also help you make adjustments in retirement if you’re at risk of depleting your savings too soon (or even too slowly).
How Do Required Minimum Distributions Factor in?
Retirees are actually required by the IRS to withdraw a certain amount of money from their retirement accounts each year.
Typically, at age 72 (but 73 for people who turn age 72 after 2022), you must take “required minimum distributions” (RMDs). These plans apply to both employer-sponsored plans (401(k)s, 403(b)s, 457(b)s, etc.) as well as tax-deferred accounts such as traditional IRAs, SIMPLE IRAs, and SEP IRAs. That said, people with workplace retirement plans can delay taking RMDs until they retire.
Roth IRAs technically do not have RMDs—at least not for the original owner. But if you inherit a Roth IRA, you must fully deplete the fund within 10 years of the owner’s death.
Any money held in taxable accounts (e.g., a traditional brokerage account) is not subject to RMDs.
As far as how much you have to withdraw under RMD rules, the IRS lays out clear guidance:
“Generally, a RMD is calculated for each account by dividing the prior December 31 balance of that IRA or retirement plan account by a life expectancy factor that the IRS publishes in Tables in Publication 590-B, Distributions from Individual Retirement Arrangements (IRAs). Choose the life expectancy table to use based on your situation.”
RMDs are generally taxed as ordinary income when taken from a tax-deferred account. Account owners who don’t withdraw the full RMD by the due date face a hefty 50% excise tax on the amount not withdrawn.
Typically, you must withdraw your RMD by Dec. 31 of a given year. However, for your first distribution, you have until April 1 of the year following the calendar year in which you reach age 72 (or 73 if born after 2022) to take your RMD. So if you turned 72 in 2025, you could wait until April 1, 2026, to take your RMD … but you would also have to take your RMD for 2026 by Dec. 31, 2026. (So, a little tax advice: If you don’t want both RMDs showing up on your 2026 taxes, you should take your first RMD in 2025.)
Related:


